Inspect file data
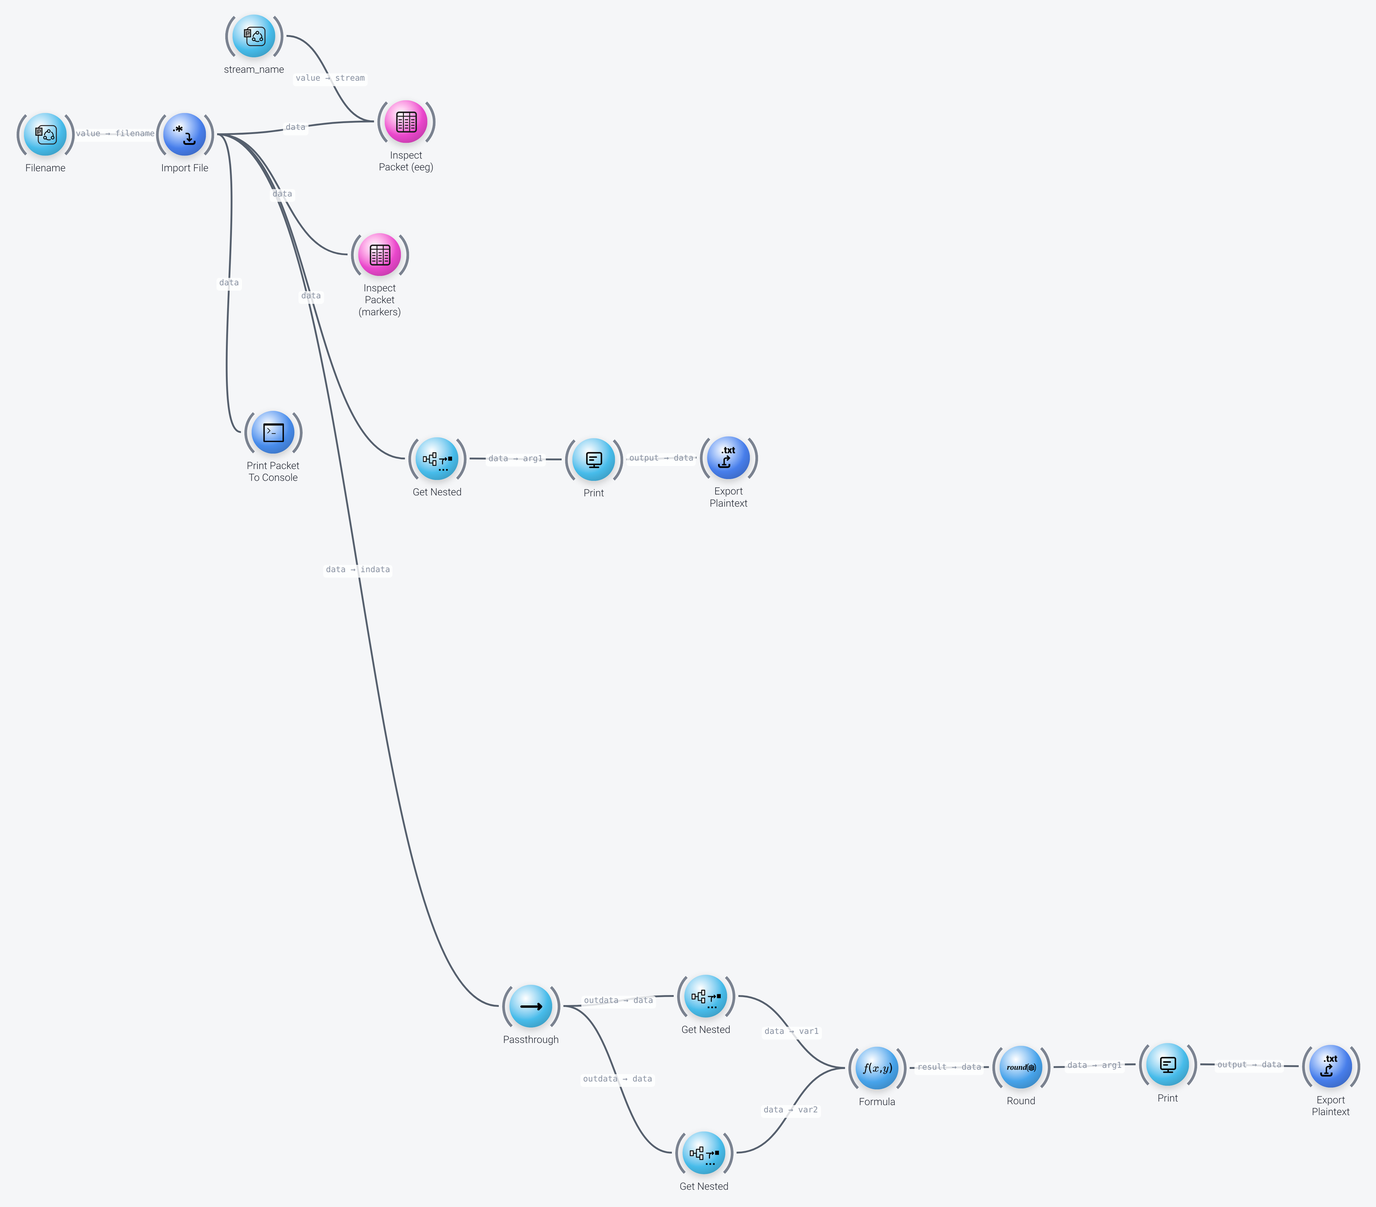
This very simple example pipeline, InspectData.pyp, imports a file that has multiple streams (for instance an EEG stream and a stream of event markers), and shows several different ways in which you can inspect the data: its structure and its numerical values. It is a useful tool when you want to know what a data file or a data packet contains, and it also shows how to pick individual elements out of the data with the Get Nested node, how to calculate with them, and how to save the results to a text file.
Importing the File
Includes: Parameter Port and Import File
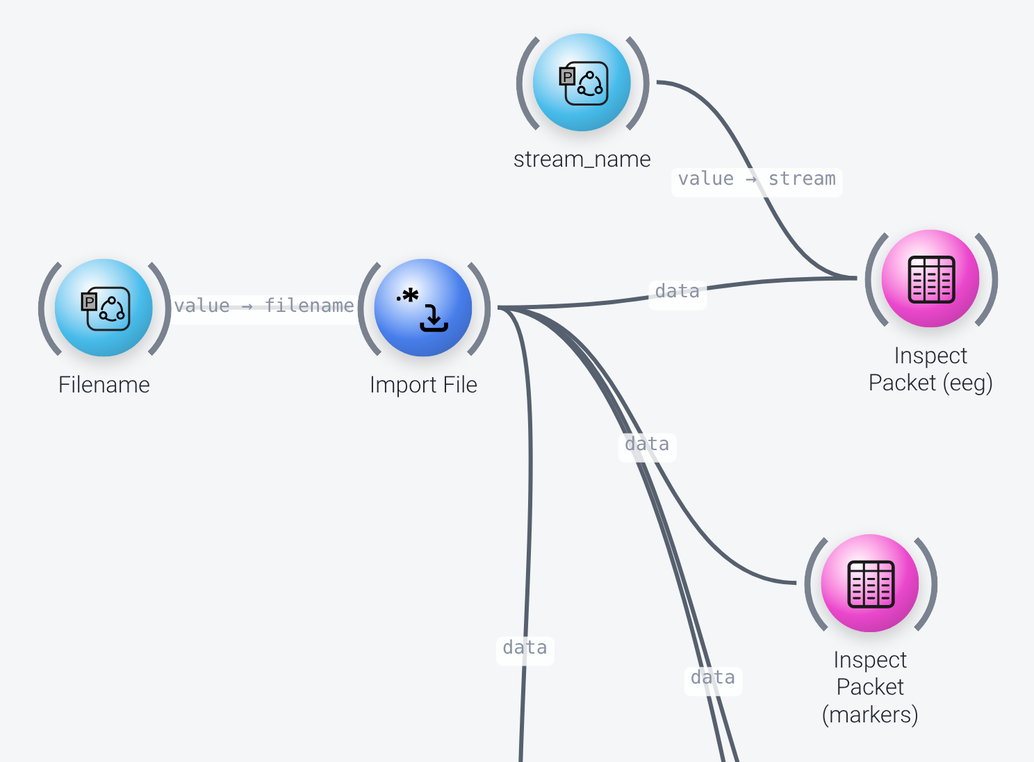
The file is imported by the Import File node, and its name is not set in the node, but comes from a Parameter Port (named Filename, with the portname input_path and the default VisualArrest.xdf). This exposes the file name as a parameter of the pipeline, so that it can be set when the pipeline is run over the NeuroPype API, or from the NeuroPype Control Panel (by right-clicking the NeuroPype icon in the Windows taskbar and selecting Run Pipeline...), rather than from Pipeline Designer. See the tutorial on exposing parameters with ParameterPorts for more on this.
The pipeline loads the entire data set at once. You could also inspect the data while "playing back" the file, by adding a Stream Data node after Import File.
Viewing the Data in Windows
Includes: Inspect Packet
The Inspect Packet node shows the contents of a data packet in a window: a table with the values of the data of a stream, with the axes of the table given by the row_axis and col_axis properties (here space and time, which is most common for raw signal data such as EEG, where space represents the channels, and time the timepoints). It also shows a table with all the axes in the stream and their values (i.e., channel names).
It also shows a list of the streams in the packet and their properties, and a list of the markers (if a marker stream is present and selected). If the packet contains multiple streams, a dropdown box is shown in the window so that the stream to view can be selected.
This pipeline has two Inspect Packet nodes (see the screenshot above), both receiving the imported data: one for the eeg stream, and one for the markers stream (its show_markers_table property is enabled so that the list of markers is shown). The stream of the first one is not set in the node, but comes from a second Parameter Port, named stream_name, which is wired into the stream port, so that a stream can be selected when the pipeline is launched.
When viewing offline (non-streaming) data, the Inspect Packet windows remain open, which keeps the pipeline running, until they are closed manually by clicking the close button. Whether data is streaming or not is determined by the is_streaming property in the properties of the stream. You can see the properties of all the streams by clicking the All Streams button in the Inspect Packet window. (The is_streaming property is set to True automatically by the LSL Input node, so incoming LSL stream packets are always marked is_streaming. Import nodes that load recorded data mark the stream as is_streaming=False.)
Printing Information about the Data
Includes: Print Packet To Console, Get Nested, Print and Export Plaintext
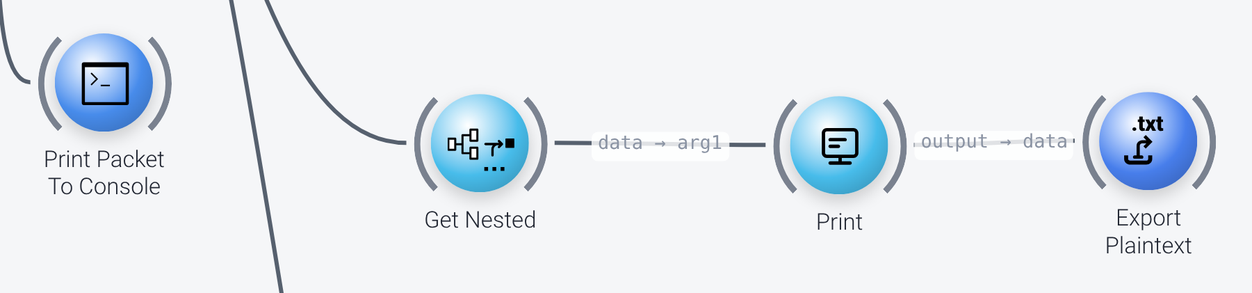
If you do not want a pop-up window, the Print Packet To Console node prints a summary of the data (its axes and its data, selected by the print_axes and print_data properties) to the output window. Note that for streaming data, this can be very spammy.
The Get Nested node is a powerful node that selects any element from the incoming data (usually a packet, but it could be any other type of object). It selects the element with the path given in its path property, written in the syntax that is set by the syntax property (here pipe). In this example, the path is :chunks|eeg|:props|source_url, which selects the eeg stream (a chunk of the packet) and its source_url property, which is the file that the data was loaded from. See the documentation of the Get Nested node for the syntax to use.
The result is fed into the Print node, which displays it with some text (its string property is Filename of source: %s). Its print_once property is enabled, to avoid printing the same value over and over again while the pipeline is running.
The output of the Print node can be saved to a text file by an Export Plaintext node, whose filename property is set to the output file (here ~/Desktop/results.txt). Its file_exists property is set to append, so that the results of the two Export Plaintext nodes in this pipeline, which have the same file name, do not overwrite each other. This can be used to save a log of results.
Calculating the Length of the Session
Includes: Passthrough, Get Nested, Formula, Round, Print and Export Plaintext
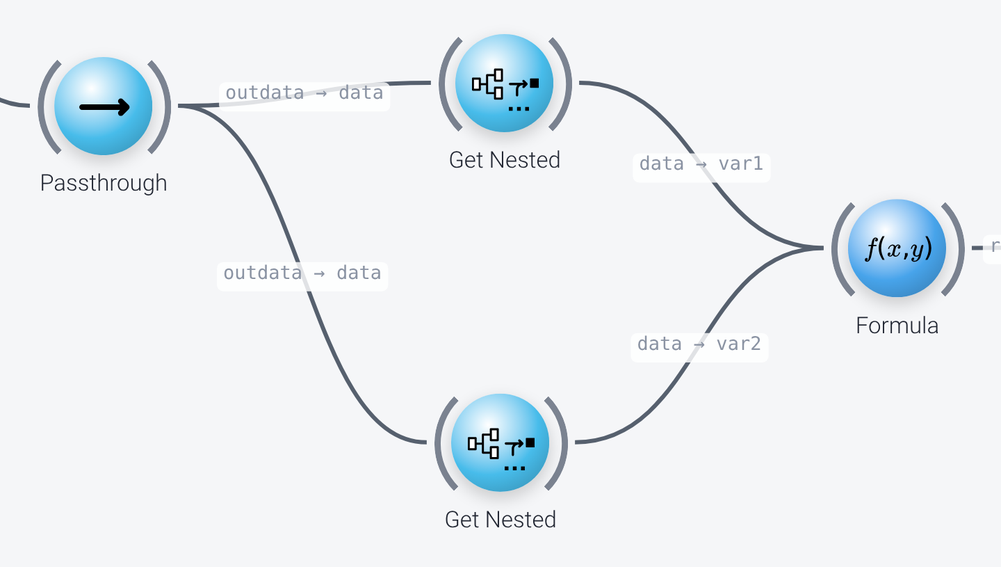
The bottom part of the pipeline shows another example of using Get Nested: it extracts the first and the last time stamp of the data, and uses them to calculate the length of the session. The Passthrough node at the beginning of this branch passes the data through to the output as long as its enabled property is set. You can use this node to turn a branch of your pipeline off (or back on), by inserting it at the desired point.
Two Get Nested nodes, whose path is :chunks|eeg|:block|:axes|:time|:times|0 and :chunks|eeg|:block|:axes|:time|:times|-1 (in the lax syntax), select the first and the last element of the array of time stamps of the eeg stream.

The Formula node comes in handy for this sort of operation. It evaluates the formula (last - first) / 60, where the variables first and last (the name1 and name2 properties) are the two time stamps, which gives the length of the session in minutes (the same could have been done with Subtract and Divide nodes, or with an Operate Constant node). A Round node rounds the result to one decimal (precision of 1), and a Print node displays it (Session length: %s min.), and saves it with an Export Plaintext node to the same file as above.