Processing and plotting live gaze (eye tracking) data
This example pipeline, GazeExtractSaccadeERPsStreamingData.pyp, processes live gaze (eye tracking) data, computes the gaze velocity and acceleration, extracts the gaze events (saccades) from it, and plots the gaze data together with the detected saccades. It is the streaming counterpart of the saccade-locked ERPs from gaze data example, which processes a recording, and also shows how to extract saccade-locked EEG ERPs from a recording.
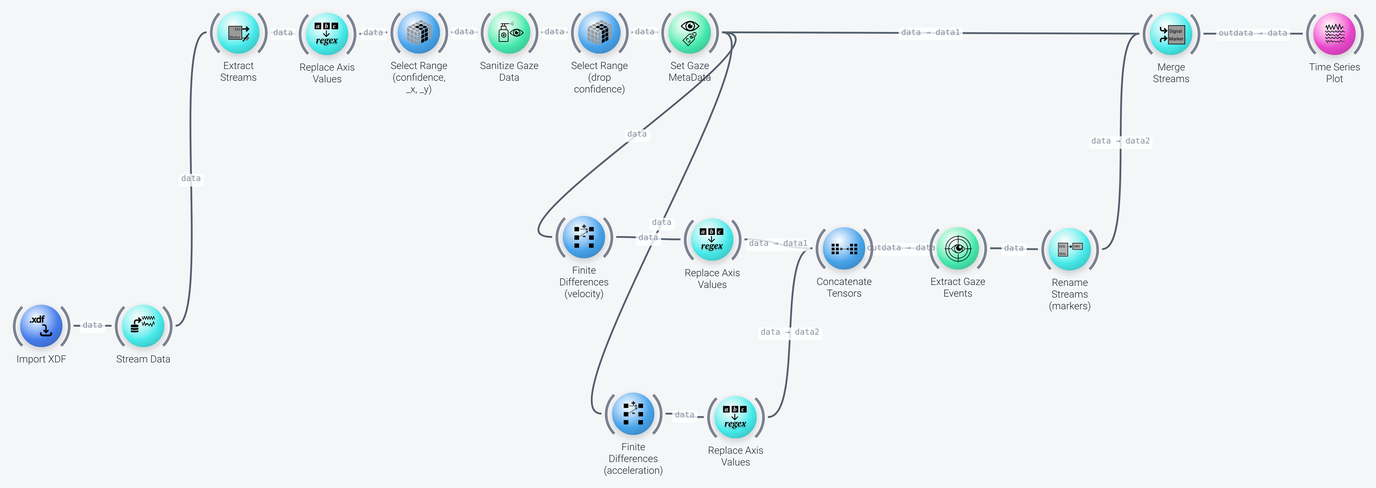
The pipeline can be divided into four parts, which we discuss in the following: data acquisition, gaze data cleaning, velocity and acceleration, and saccade detection and plotting.
Data Acquisition
Includes: Import XDF, Stream Data and Extract Streams
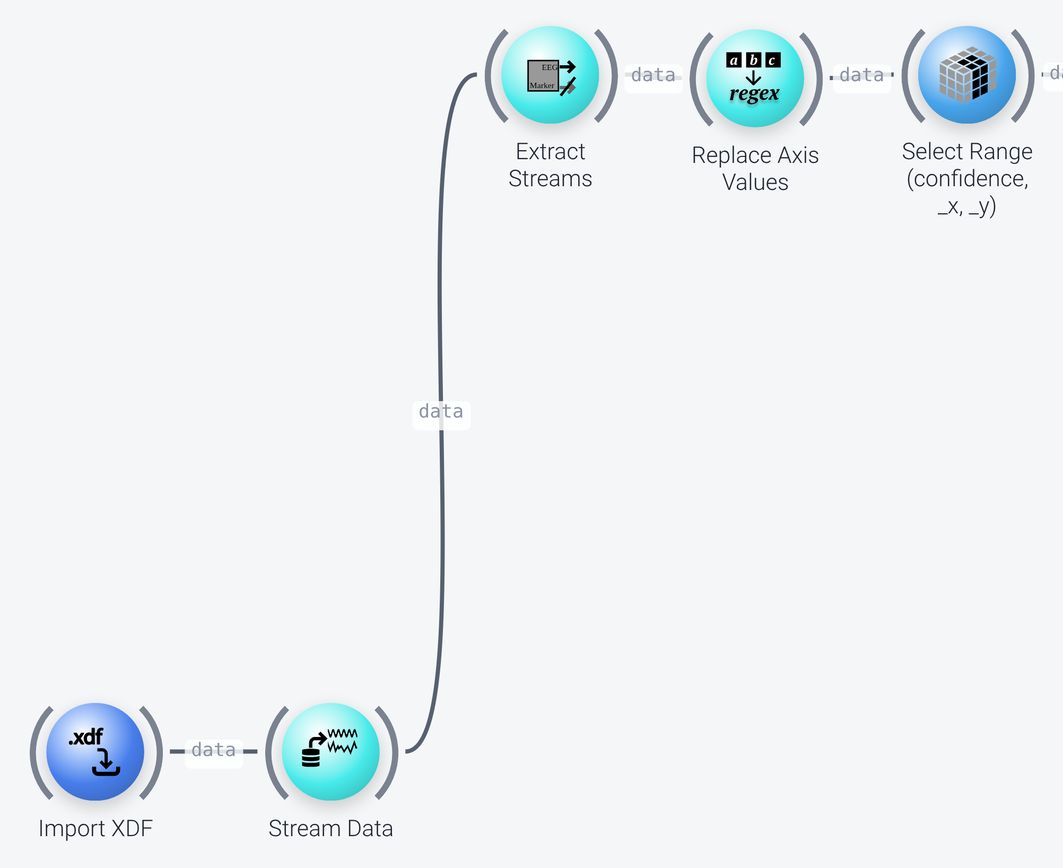
To simulate a live eye tracker, the pipeline imports a recording (sample-gaze-data.xdf, the filename property of Import XDF), which contains EEG and gaze data recorded with an eye tracker, and plays it back with the Stream Data node, as if it were streaming. For use with live data, you would replace these two nodes with an LSL Input node that receives the stream of your eye tracker. See Data input in the example pipelines for more on this.
The Extract Streams node then keeps only the gaze stream, selected by its name (the stream_names property is ['gaze']), since the data source can contain several streams (such as EEG).
Gaze Data Preprocessing
Includes: Replace Axis Values, Select Range, Sanitize Gaze Data and Set Gaze MetaData
The nodes in the top row of the pipeline clean up the gaze data:
- The first
Replace Axis Valuesnode (see the screenshot above) renames the channels of the gaze stream using a regular expression (pattern_typeofregex): the prefixgaze_ang_deg_of the channel names is replaced byang_, so that the channels that give the gaze angle are calledang_xandang_y. - The first
Select Rangenode (named Select Range (confidence, _x, _y)) selects the channels of interest by their names (theselectionproperty, withunitofnames), which are the confidence of the eye tracker in the reported gaze, and the x and y components of the gaze angle:confidence,ang_xandang_y.
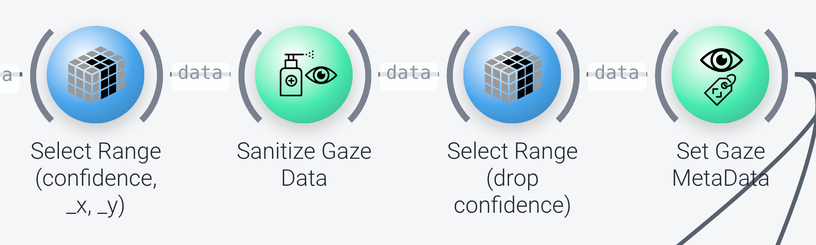
Sanitize Gaze Datacleans up the gaze data before the gaze events are extracted. It replaces the samples that are bad, which are those that are missing or whose confidence is below theconfidence_threshold(here 0.6), by interpolating them (the method is chosen with thehandle_badproperty, which iscross-interpolatehere). See the documentation of the node for the details of the methods.- A second
Select Rangenode (named Select Range (drop confidence)) drops the confidence channel, which is no longer needed, and keeps the two gaze angle channels. Set Gaze MetaDataoverwrites the screen-related metadata of the gaze stream. It is used with its default settings here.
Velocity and Acceleration
Includes: Finite Differences, Replace Axis Values and Concatenate Tensors
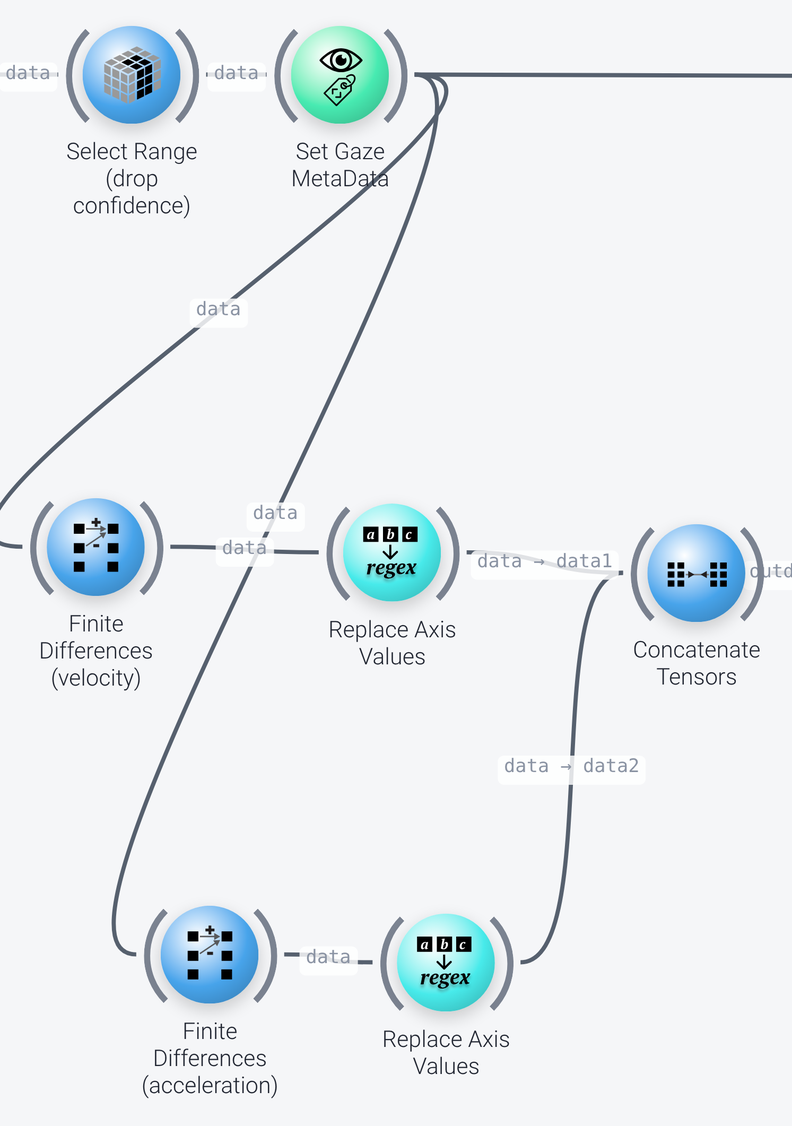
The method that is used to detect the saccades needs the velocity and the acceleration of the gaze. They are calculated from the gaze position by two Finite Differences nodes that work in parallel on the time axis: one with an order of 1, which gives the velocity, and one with an order of 2, which gives the acceleration (scale_by_timestep is enabled, so that the result is scaled by the time step). Their keep_shape property is enabled, so that the result has the same shape as the input.
To tell the new channels apart, each of them is followed by a Replace Axis Values node that appends a suffix to the channel names, using the regular expression ($) (which matches the end of the name) and the replacement _vel or _acc, so that the channels are called ang_x_vel, ang_y_vel, ang_x_acc and ang_y_acc. A Concatenate Tensors node then concatenates the velocity and the acceleration channels along the space axis.
Saccade Detection and Plotting
Includes: Extract Gaze Events, Rename Streams, Merge Streams and Time Series Plot
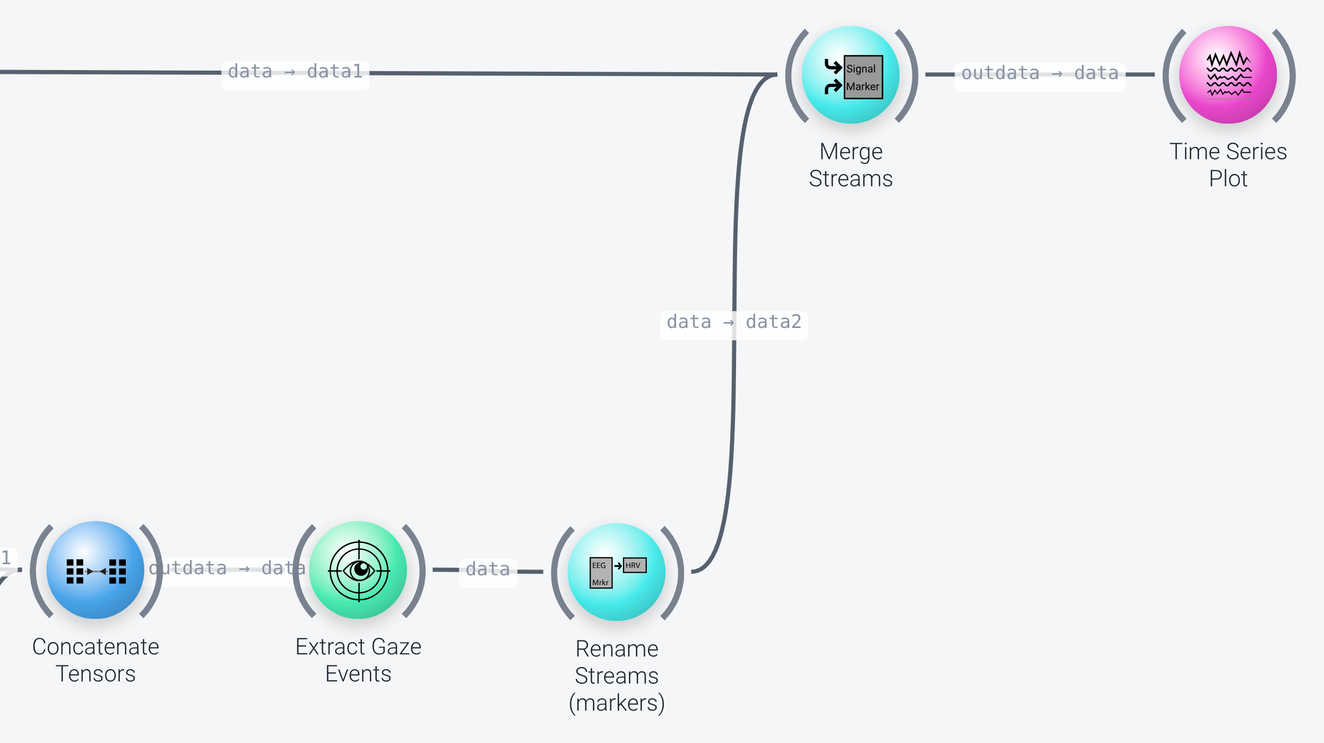
Extract Gaze Eventsdetects fixations and saccades in the continuous gaze data. Here, only saccades are detected: thefixation_algorithmis set tonone, and thesaccade_algorithmisV+A threshold, which uses a threshold on the velocity (velocity_thresholdof 8) and on the acceleration. The result is a stream of events, one for each saccade.Rename Streamsrenames the stream of events fromgazetomarkers(itsname_changesproperty), so that it is treated as a stream of event markers.Merge Streamsmerges the gaze data (fromSet Gaze MetaData, see the screenshot of the cleaning nodes) and the stream of events into one packet, and aTime Series Plotshows the gaze data of the last 5 seconds (time_range), with the detected saccades displayed as markers (plot_markers).